Twitter activity of the US members of Congress from 2007 to 2017
Author: Akim van Eersel
Date: 2021-04-21
Social media communication patterns
The main analysis aims to get insights in two major topics.
- Some key points about Congress members Twitter presence and how do they perform and interact.
- Common patterns about what Congress members communicate.
To address these issues three specific questions were selected to obtain some of the information sought.
- The relationship between popularity and activity on Twitter as well as the states population of members of Congress.
- Do members of Congress from more populous states have more followers?
- Do members of Congress who post the most have the most followers?
- Do the colors of the images of the Twitter accounts (profile and cover) are mainly split between red and blue ?
- What are the most used words/hashtags by members of Congress?
Hypotheses
- The more a member of Congress tweets the more he/she is being followed. The same assumption is made regarding the population of the states.
- However, the date of creation of the twitter account should strongly model these assumptions.
- There is a good chance that the colors red and blue are used a lot depending on the parties of members of Congress.
- However, the result could be biased by how to measure/calculate the dominant color of the whole image or a piece of it.
- Getting strong predictions of which words/hashtags are most used is complex without any knowledge, but chances are that among them are the words Democrat and Republican, as well as Obama and Trump (and/or a compound word like Obamacare).
Analysis approach
After collecting, cleaning and transforming the data some usual steps are processed.
- Getting features descriptive statistics: range, outstanding data, distribution.
- Quantitative analysis: relationships measurements between variables, regression.
- Qualitative analysis: in this case it's about text analysis.
Data architecture
Two JSON files make up the dataset, one gathering the Twitter accounts of members of Congress and the other all the actions (tweets, retweets, etc.) of these accounts. From the features needed to answers our problematics, the following EDR can summary the tables processed.
US states and their population were gathered and add in a table as well.

Data analysis
Initial insights: Twitter popularity and activity
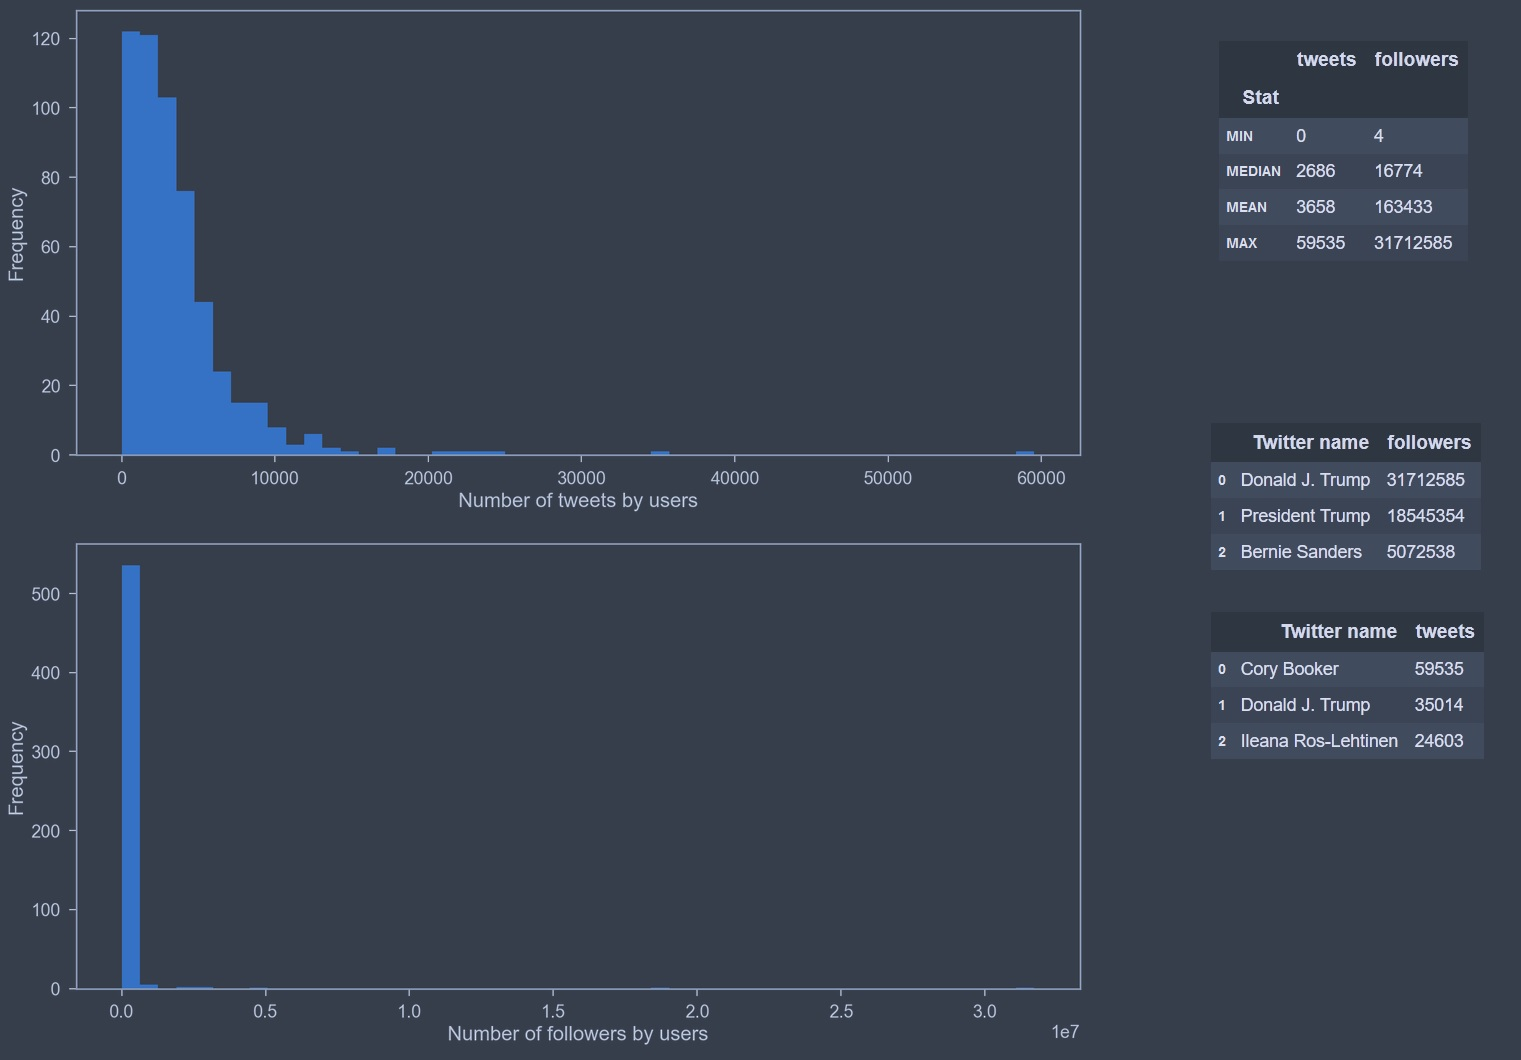
Among the members of Congress on Twitter, there are extreme cases who have a very large number of followers or write a very large number of tweets and far ahead of their colleagues.
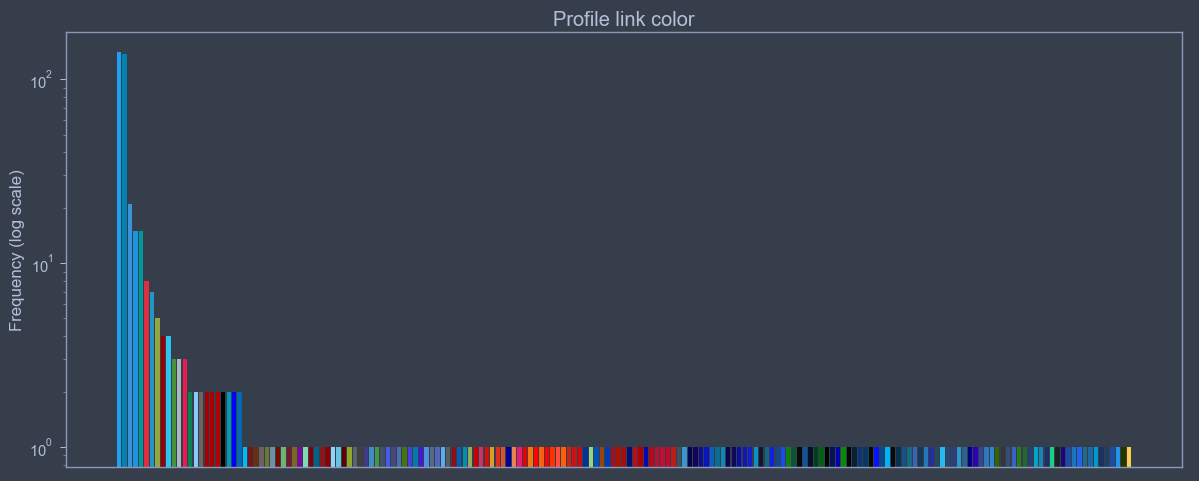
Initial insights: Twitter profile colors
From the observation of the distributions of the different variables linked to the colors, it is difficult to obtain convincing results. However, among the 5 color features metrics, profile link color seems to contain mostly only shades of red and blue. There is therefore at least one of the variables which verifies our initial hypothesis.
- There are several shades for the same color (or range), which dissociates the data instead of grouping them and consequently makes the analysis much more difficult. Therefore, this analysis is subsequently dropped.
Initial insights: tweets text
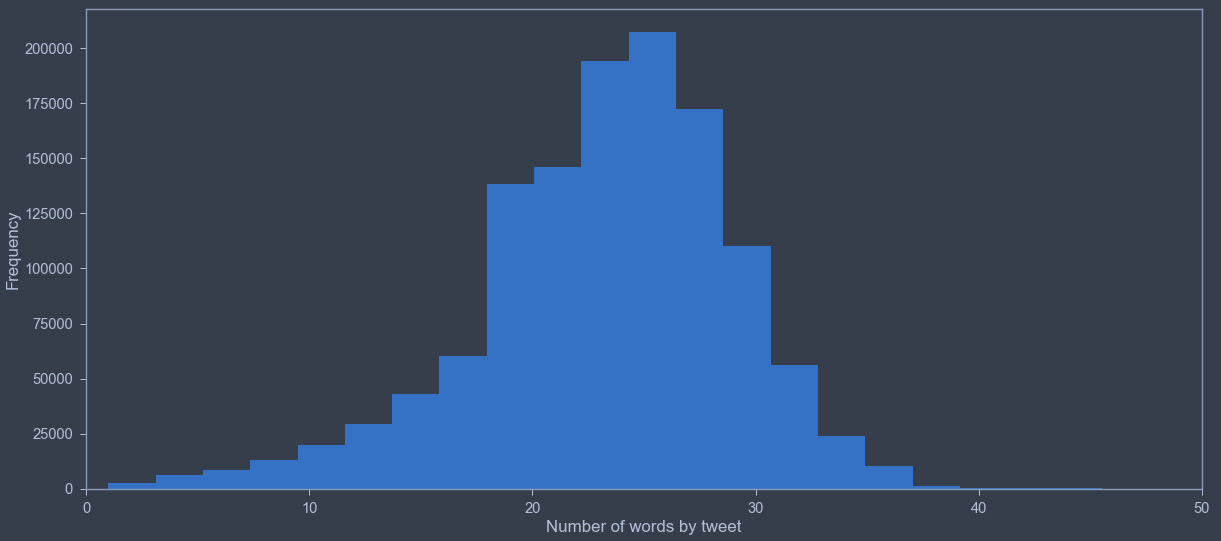
In order to get an overview, a variable that counts the individual words according to NLP rules was created.
Most of tweets follows a similar pattern with a number of words per tweet near the average value of all Congress members tweets. This is expected as Twitter limit the number of characters by tweet to a low amount, 140 in total. This necessarily implies having a limited number of words but leaves a little flexibility in the way of constructing a concise message.
Relationships analysis: Twitter popularity and activity
Initial variables weren't under normal law assumptions, as seen previously with their distribution plots. A logarithmic transformation was used to create suitable metrics for the analysis.
There are clearly correlations (statisticly significant) and linear responses between number of followers and number of tweets, as well as number of followers and the account creation date.
- Every 35% increase of written tweets leads in average a 24% increase of followers.
- Each year passed leads in average a 14% increase of followers.
However, the number of inhabitants of the states represented by members of Congress has no impact on the number of followers. Which is the reverse of the initial hypothesis.
scatter(congress_members)

Text analysis: tweets patterns
After removing meaningless words (i.e. stop words like "the, "a", etc ...), the motion char below show the top 10 most written words between 2008 and 2017.
fig
Many of the most used words are hardly surprising either by the lexical field used or by the political context. Indeed, "american", "US", "bill", "care", "health", "house", "congress" are all words that are strongly related to the nation, to the function, and to the law.
Clearly one would have expected that one of the most used words on Twitter would be "rt", but this was not taken into account when making assumptions.
The words "obamacare" and "trump" appeared in the top 10 most quoted words in 2013 and 2017 respectively. The initial hypothesis is therefore partially verified.
Hypotheses conclusions
- Twitter popularity and activity assumptions:
- The more the number of tweets, the more the number of followers. ✅
- The older a Twitter account is, the more followers it has. ✅
- Population of the state represented by the congress member Twitter account have not any impact on the number of followers.❌
- Twitter profile color assumptions:
- Data and their metrics didn't allow clear conclusions. ❕
- Tweets common patterns assumptions:
- "Democrat" and "Republican" words didn't appeared. ❌
- "Obama" and "Trump" related words appeared some years among the top 10 most used words. ✅
Further potential analysis
To get additional informations regarding the current conclusions, here's some ideas to consider:
- Getting Congress members party could lead to hidden patterns among the previous steps taken in this report. But it requires a data collection substantial work.
- Finding a way to group shades of colors and continue the analysis initiated.
- Doing the famous sentimental text analysis and linking insights with the other features.